
The 2025 DTC Mega Report
The Definitive Financial Analysis of Direct-to-Consumer
This is not another trends report filled with vague platitudes and recycled wisdom. This is the definitive, data-driven truth about what separates the winners from everyone else in Direct-to-Consumer.
Revenue Analyzed
Orders Analyzed
Customers Analyzed
The Numbers That Matter
Four metrics that define the state of DTC in 2025
Median AOV
Median LTV:CAC
Contribution Margin
90-Day Repurchase
"The difference between brands that scale and brands that stall isn't marketing spend or product quality alone. It's the fundamental unit economics that compound over time."
37% of DTC brands don't recover CAC on the first order. They're betting everything on repeat purchases that may never come.
31% operate in the danger zone with contribution margins below 10%. At these levels, there's no room for experimentation or growth.
The 3 Immutable Laws of DTC
The fundamental truths that govern every successful direct-to-consumer business
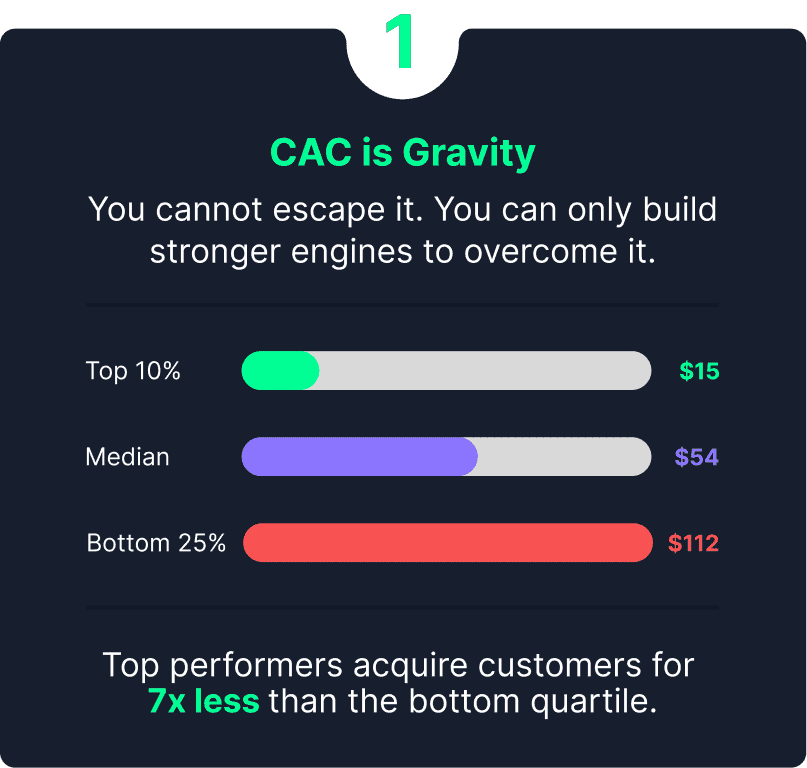
CAC is Gravity
You cannot escape it. You can only build stronger engines to overcome it.
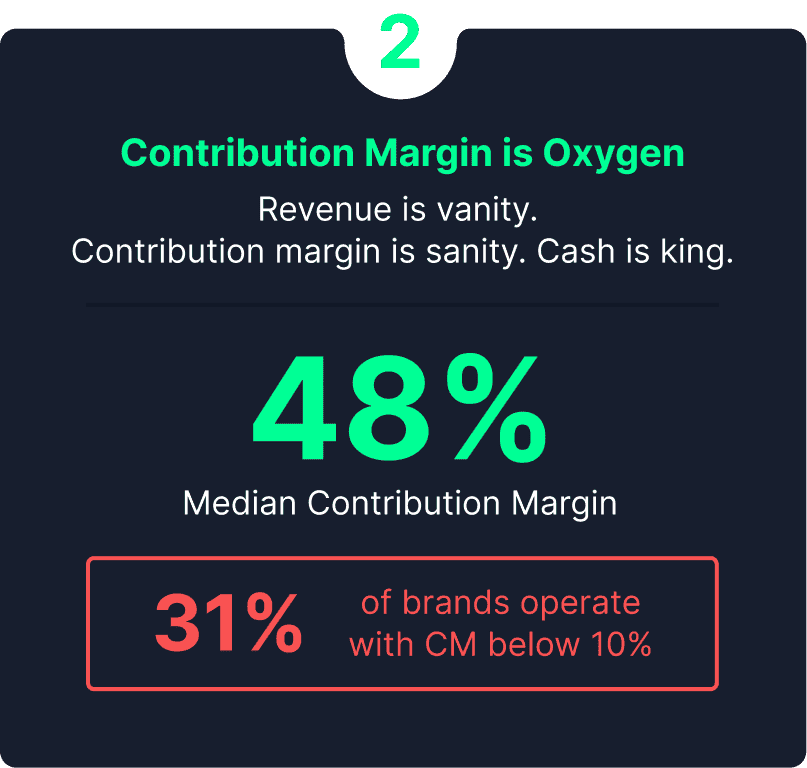
Contribution Margin is Oxygen
Revenue is vanity. Contribution margin is sanity. Cash is king.
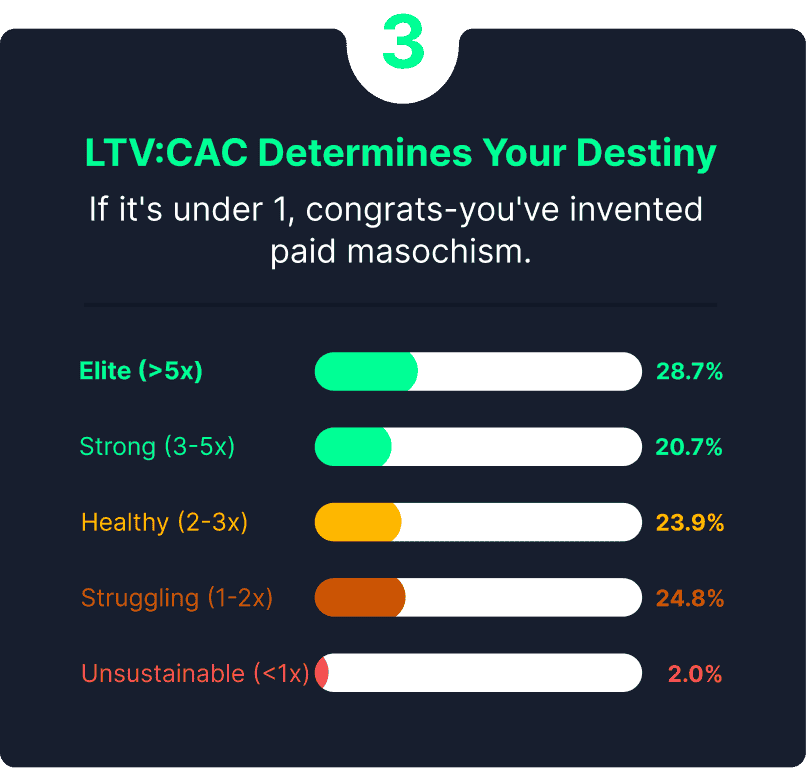
LTV:CAC Determines Your Destiny
If it's under 1, congrats — you've invented paid masochism.
The Cost Structure That Kills
Marketing spend is the #1 predictor of margin compression.
Contribution Margin
Brands with <25% Marketing Spend
Contribution Margin
Brands with 50%+ Marketing Spend
The Marketing Cliff
Brands spending 50%+ of revenue on marketing have 3.5x worse margins than disciplined spenders. 12% of brands are trapped in this danger zone.
| Industry | COGS% | Shipping% | Marketing% | Contribution Margin% |
|---|---|---|---|---|
| Fashion & Apparel | 10.3% | 8.1% | 22.1% | 60.5% |
| Health & Wellness | 14.3% | 11.2% | 24.2% | 49.0% |
| Home & Garden | 14.0% | 12.0% | 22.6% | 47.5% |
| Food & Beverage | 17.4% | 13.5% | 17.6% | 47% |
| Sports & Outdoors | 11.0% | 8.1% | 37.1% | 45.3% |
| Pet Supplies | 13.1% | 9.8% | 34.6% | 44.3% |
| Jewelry & Accessories | 10.7% | 7.4% | 31.9% | 44.3% |
| Automotive | 11.6% | 8.6% | 35.6% | 43.4% |
| Beauty & Cosmetics | 12.4% | 9.5% | 32.8% | 41.0% |