Make Customer Lifetime Value actionable for eCommerce: Increase margins and keep CAC down.
Customer Lifetime Value (CLTV or LTV). You’ve heard of it, you’ve seen the definitions and the formulas, you’ve probably read countless articles about how it is one of the key KPIs that every D2C brand must track.
Definition CLTV or LTV: The total revenue value of the average customer over the whole period of their relationship with the brand.
What is the true benefit of knowing your customer lifetime value?
LTV tells you that customers are coming back. That’s great news. LTV is also a great metric to use to spot early signs of attrition and combat them.
It also informs when and how you invest in post purchase marketing, so that over time you can realize the lifetime value of that customer- or wait- **does it? **
As the cost of acquisition on marketing channels like Google and Facebook continue to rise, it is increasingly difficult to turn a profit from paid acquisition, regardless of what retention strategies you implement.
LTV does not tell you how many of your customers actually turn into repeat buyers, nor does it shed light into how long it takes for a new customer to make a second purchase. It does not tell you when to run winback campaigns or which products attract your highest value customers so that you can promote those in winback campaigns.
Without those insights, your post-purchase marketing strategy is akin to firing into a dark room and hoping to hit something. The terrifying reality is that while you wait to realize customer lifetime value, your brand could run out of cash flow and go under.
If LTV on its own is a vanity metric, how can brands actually use it to their advantage?
Figure out your Repurchase Rate
The first thing to determine after LTV is your repurchase rate. Repurchase rate refers to the percentage of customers who turn into repeat customers.
Your repurchase rate report should be broken down into two segments- the first looking at the percentage of new customers who make a second order and the second looking at repeat customers repurchasing.
To further improve on the value of this metric- you’ll need to break down your repurchase rate data over fixed time periods. This would break down how many new customers make a second order within 30 days, within 90 days, 180 days or even a year after their first order.
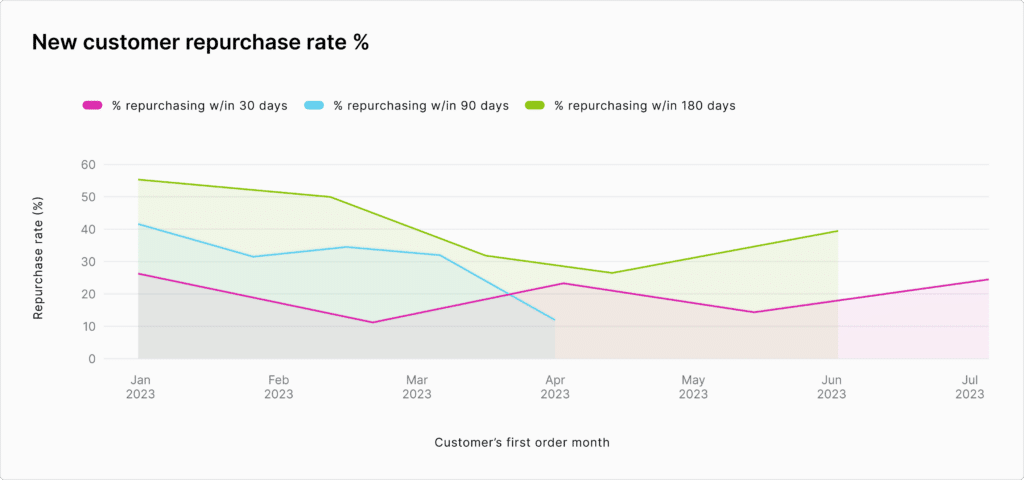
For most brands, focusing on the 90 day window makes sense as getting that second order from a customer within 3 months helps with cash flow and gives you room to scale customer acquisition cost.
Looking at your repurchase rate within a fixed timeframe also gives you insights into how your post-purchase marketing funnels are performing. A sudden dip in repurchase rate within your 90 day window could indicate that you are acquiring a lower quality of customers from your acquisition funnels or it could be that your actual product has changed recently- affecting the repurchase rate.
Once you’ve understood the repurchase rate you can then delve into the actual time lag between orders.
Time lag between orders
A time lag report calculates time between repeat orders for every customer during the selected time period and shows the distribution over time. Simply put- how many days does it take for a customer to make a repeat purchase?
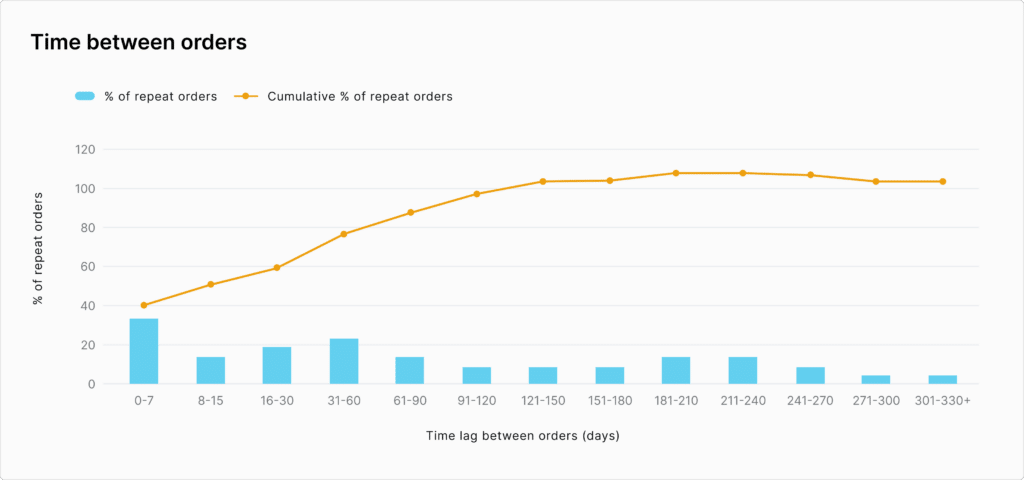
This data is vital in determining the optimal timeframe to launch winback campaigns.
If we know that most of the customers repurchase within 60 days after their previous purchase it makes sense to time your winback emails around 65-90 days after a customer’s previous order.
If you send the campaign out earlier you might give up some of your profit margin as you might be providing discount codes to incentivise customers who might have repurchased anyway.
Conversely if you send out winback campaigns after that 65-90 day period, there is a high chance that customer is not coming back and your campaigns will not have the desired impact.
If we take a look at the dashboard from our example store below, we can see that the 90 day window seems to be the hot period in the customer lifecycle within which the potential to repurchase is high and after 90 days the chances of repurchase are lower.

Many brands are not running winback campaigns optimally because they fail to identify the peak window of opportunity within which repurchase is most likely to occur.
Once you know your purchase frequency or repurchase rate, you have a data-backed time horizon to work with, to actually improve your LTV. This will help you plan out a post-purchase marketing campaign that keeps you and your brand top-of-mind.
What else?
Finally, understanding repurchase rate and the time lag between orders improve LTV by helping you with questions like;
-
Based on when they make a second order and the value of the products being repurchased, which customers are more valuable to my brand?
-
When will these high value customers make their third, fourth (and so on) purchases?
-
How can I tailor my marketing to attract more of these customers and reduce the time lag between purchases?
Bonus tip A question we frequently get asked from brands is- what is a great repurchase rate, what should my brand aim for? The answer depends on the category of products you are selling. As a rough guide, for non-consumable goods like clothing or homeware, a good repurchase rate is anything above 15%. That is a measure of how effective your post purchasing marketing strategy is.
Neeta Nelson
Neeta is an eCommerce writer at AMP focused on helping Shopify brands improve retention, conversion, and profitability.