Mar 20, 2024
eCommerce Benchmarks- A free report to take the guesswork out of growth.
Looking at your data in isolation can make decision making challenging especially when you don’t have any relevant industry data to compare it against. If your 90 day repurchase rate is 25% is that good? What should your margins look like if you sell clothing online?
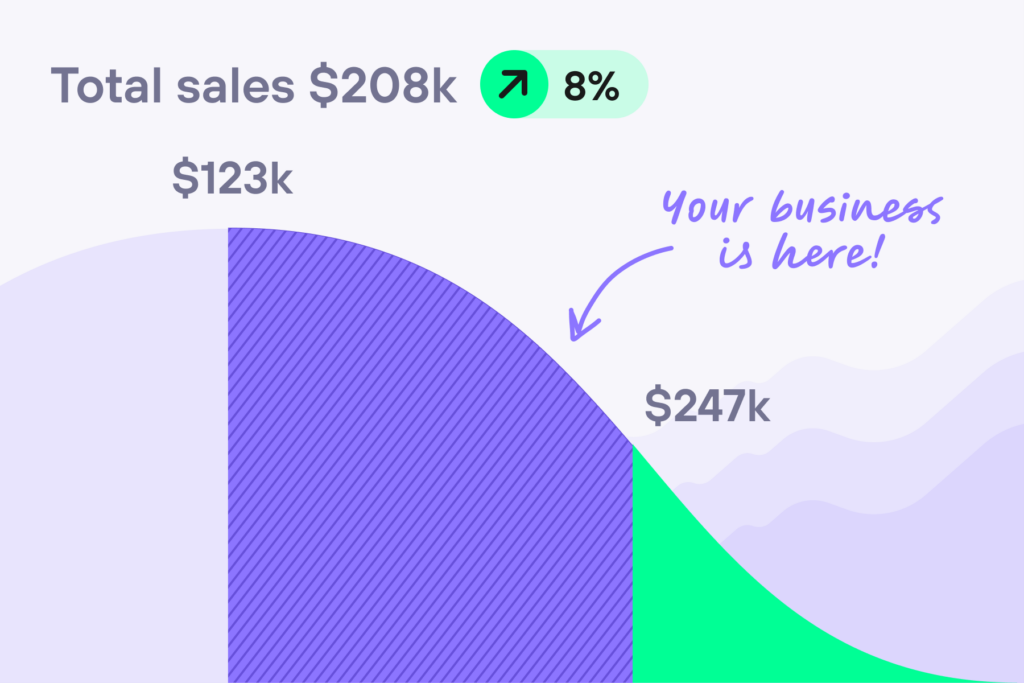
AMP’s new benchmark report takes the guesswork out of growth by comparing your store data against thousands of your competitors for a meaningful understanding of how your store stacks up against the competition. Before we go into the nitty gritties of what data you can leverage in the report- let’s go back to basics and take a look at what benchmarks are and why they are useful in informing growth strategy.

What are benchmarks?
Benchmarks are key metrics broken down by industry to establish a standard by which businesses can assess their performance. Having visibility into Industry benchmarks is essential for setting realistic targets, as they show how you compare to the competition and where you might be leaving money on the table or should allocate resources more effectively.
AMP’s leverages data from thousands of merchants in its dataset, which increases the accuracy and relevance of the benchmark data because AMP data goes beyond comparing your data to just eCommerce merchants in general and dives deeper into benchmarks within each specific category or industry (eg: Apparel, Beauty, Fitness etc). Comparing your performance to stores similar to yours give you a strong competitive advantage.
What key metrics (or KPIs) can I leverage with the Benchmarks Report?
AMP’s Benchmark Reports provide context for how your business metrics stack up against peers in your industry across 11 key metrics, making your data more actionable. Here are some of the most popular metrics.
Total Sales
Total Sales is a metric that represents the sum of all sales generated by a store over a specific period of time. It includes sales from all products and orders, including taxes, discounts, and shipping fees.
Gross Margin
Gross profit margin is the profit after subtracting the cost of goods sold (COGS). Put simply, a company’s gross profit margin is the money it makes after accounting for the cost of doing business. This metric is commonly expressed as a percentage of sales and may also be known as the gross margin ratio.
Average Order Value
Average Order Value (AOV) refers to the average amount spent by a customer during a single transaction on your eCommerce platform. It is calculated by dividing the total revenue generated by the number of orders placed.
Repurchase Rate
Customer Repurchase Rate measures the % of customers repeat customers who ordered again within a specific number of days of their previous purchase. It’s a good way to understand how loyal your customers are and what your long-term LTV of the customer may be.
Customer Acquisition Cost
The average customer acquisition cost refers to the amount of money spent on acquiring new customers. It is important to consider this cost in CLV calculations to understand the profitability of acquiring and retaining customers.
Return on Ad Spend
Return on Ad Spend (ROAS) is a marketing metric that measures revenue earned for each dollar you spend on advertising. By calculating and tracking ROAS, you gain insights on the effectiveness of your advertising.
Contribution margin
Contribution margin is the amount by which your business’s sales revenue exceeds your variable costs. It’s just another way of looking at profit. Put simply, whenever you deliver a service or product and deduct the variable cost associated with delivering that product, the revenue you’re left with is the contribution margin.
Marketing % of Net Sales
Marketing % of Net Sales refers to the total marketing spend divided by net sales x 100. This is the percentage of sales that went toward marketing spend.
What next?
Now that you understand benchmarks and have access to the benchmark report, the next step is to automate and consolidate your data and your industry data all on one platform so that you can continually track your top KPIs. Lifetimely by AMP gives your accurate and automated metrics that empowers you with the confidence to make better business decisions.
See the big picture with the level of detail no other app can match. Dive deeper with Lifetimely today.
See how your data compares to stores like yours.
Start today,
for free
Start a free trial of any of AMP’s tools today.

