









eCommerce Benchmarks - How do your Total Sales numbers stack up against stores like yours?
Total Sales (including taxes) is the amount of revenue that your business has generated after both discounts and refunds have been deducted.
Total Sales
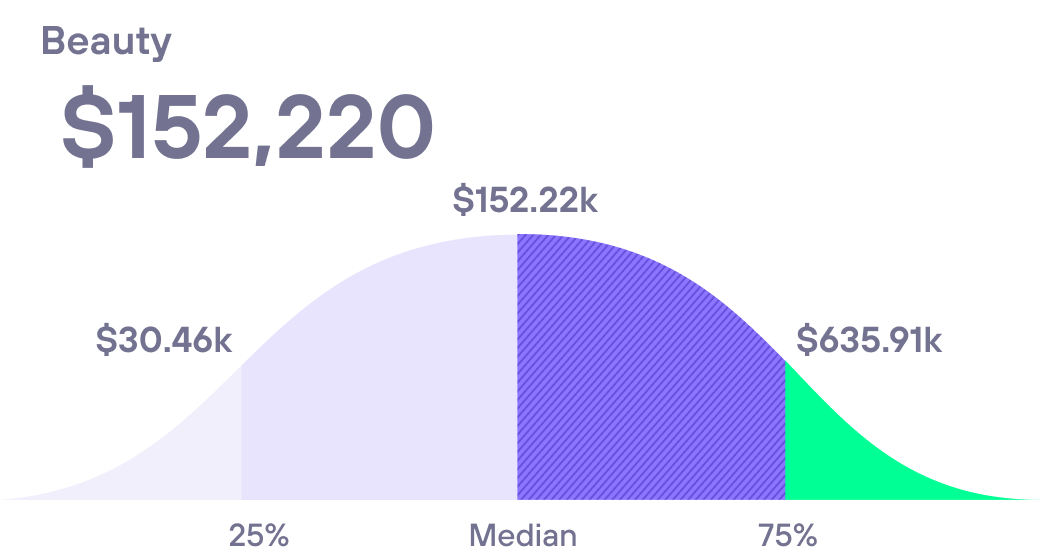
Beauty eCommerce brands on an average realize around 150K in total sales within a 90 day period, however the top 25% of beauty brands realize around 600K in total sales- making their margins significantly higher. What do your 90 day Total Sales numbers look like?
Want to see benchmarks for your business?
Get a free report tailored to your industry, products, and business size.
Take a deep dive into eCommerce metrics

Profit and Loss
See how cashflow metrics compare to yours across a range of industries and business types.

Orders
See how order value metrics compare to yours across a range of industries and business types.

Retention
See how customer retention metrics compare to yours across a range of industries and business types.

Acquisition
See how customer acquisition metrics compare to yours across a range of industries and business types.

Industries
See how businesses in each industry compare to yours across our eleven key metrics.
Get your free Benchmarks report
Tailored to your business by industry, products sold, and more.
Every eCommerce metric you need
Run your Shopify store with unmatched analytics, at unmatched prices.
Ready to grow smarter?
See how Amp's suite of tools can help your Shopify store increase revenue and understand your customers.