Electronics eCommerce Benchmarks, compare data to stores like yours
Electronics stores experience a higher median total sales when compared to other categories in our data set ($229k vs $129.9k for beauty and $251.6k for apparel stores). This can likely be explained by the higher average order value that electronics stores see ($83 vs $63 in beauty and $56 in food & beverage).
Electronics stores also experience favorable gross and contribution margins as well (median gross margin for electronics stores is 68% versus 62.59% for apparel stores and 63.24% in the food & beverage category).
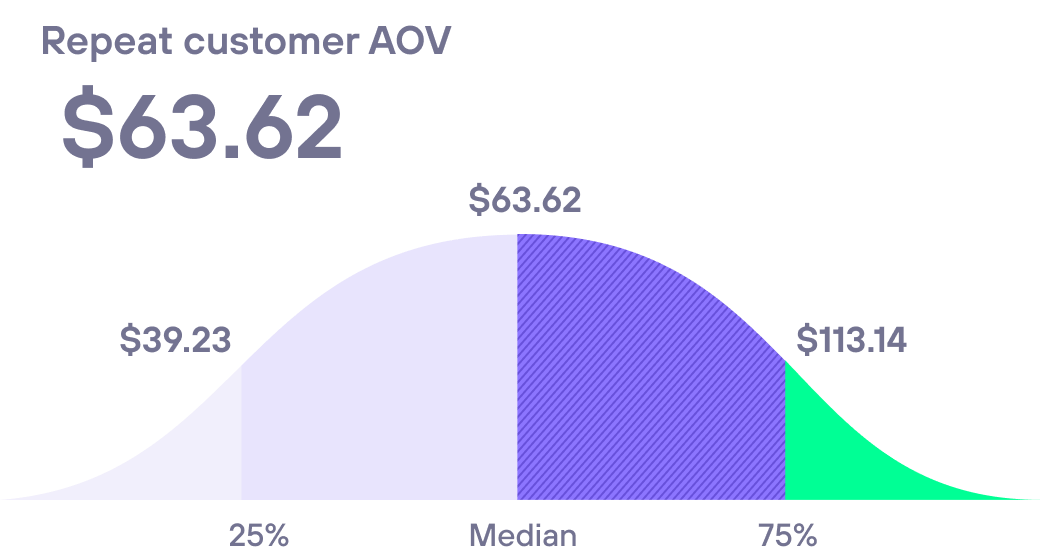
Repeat Customer AOV
Repeat Customer AOV refers to repeat customer sales (after discounts and before refunds) divided by the number of repeat customer orders in the time period.
Did you know that the average online Electronics store's Repeat Customer AOV is $63.60. What is your AOV?
New Customer Repurchase Rate
90 Day New Customer Repurchase Rate refers to the % of customers who made a second order within 90 days after their first order.
Electronics businesses see an average of 8.26% of new customers returning to make a repeat purchase within 90 days. What is your repurchase rate?

Want to see benchmarks for your business?
Get a free report tailored to your industry, products, and business size.

This app is an absolute no brainer. It's super comprehensive, but at the same time simplifies of the important data we need know to improve our paid acquisition, retention efforts and product mix. They also offer outstanding support. Get this app!
Shop Solar Kits
Take a deep dive into eCommerce metrics
Profit and Loss
See how cashflow metrics compare to yours across a range of industries and business types.
Orders
See how order value metrics compare to yours across a range of industries and business types.
Retention
See how customer retention metrics compare to yours across a range of industries and business types.
Acquisition
See how customer acquisition metrics compare to yours across a range of industries and business types.
Industries
See how businesses in each industry compare to yours across our eleven key metrics.
Get your free Benchmarks report
Tailored to your business by industry, products sold, and more.
Every eCommerce metric you need
Run your Shopify store with unmatched analytics, at unmatched prices.
Ready to grow smarter?
See how Amp's suite of tools can help your Shopify store increase revenue and understand your customers.