Homewares & Furniture eCommerce Benchmarks, compare data to stores like yours
Homewares stores see a high median total sales compared to other categories in our data set ($215k vs $129.9k for beauty and $130.1k for food & beverage). This can likely be explained by the significantly higher average order value homewares stores experience ($111 vs $63 in beauty and $56 in food & beverage).
This ultimately signals that homewares stores likely experience a similar order volume to other categories, but their high AOV helps increase total sales.
Gross Margin
Gross margin is calculated by taking total sales and subtracting taxes and Cost of Goods Sold and then dividing the remainder by net sales.
The top 25% of Homeware brands have a gross margin of 96.77%. What is your brand's gross margin and how do you stack up against the competition?

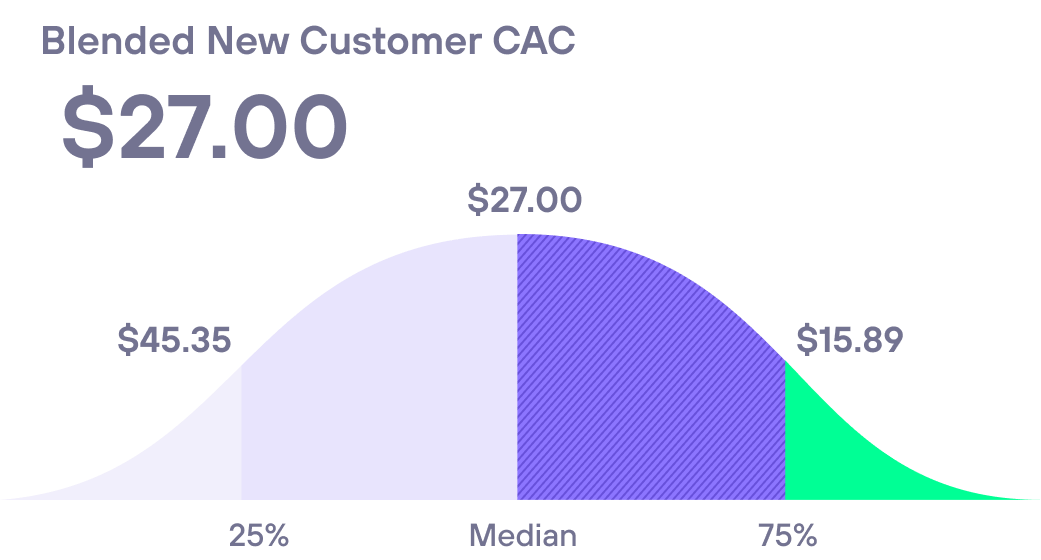
New Customer Acquisition Cost
Blended New Customer CAC refers to the total marketing spend divided by the number of new customers.
Homewares stores have an average Blended New Customer CAC of $27.42. What is your Blended New Customer CAC and how do you stack up against your competition?
Want to see benchmarks for your business?
Get a free report tailored to your industry, products, and business size.

Very robust app that gives you a full picture of the financial health of your business. Very knowledgable and responsive support team. Highly recommend to any marketer or e-comm owner.
Prospect Print Co

Take a deep dive into eCommerce metrics
Profit and Loss
See how cashflow metrics compare to yours across a range of industries and business types.
Orders
See how order value metrics compare to yours across a range of industries and business types.
Retention
See how customer retention metrics compare to yours across a range of industries and business types.
Acquisition
See how customer acquisition metrics compare to yours across a range of industries and business types.
Industries
See how businesses in each industry compare to yours across our eleven key metrics.
Get your free Benchmarks report
Tailored to your business by industry, products sold, and more.
Every eCommerce metric you need
Run your Shopify store with unmatched analytics, at unmatched prices.
Ready to grow smarter?
See how Amp's suite of tools can help your Shopify store increase revenue and understand your customers.