Apparel eCommerce Benchmarks, compare data to stores like yours
Apparel stores tend to enjoy a higher total sales number than stores selling other categories of products (I.e. beauty products, food & beverage, etc). In fact, the median total sales number is almost 2x higher than other categories ($251k for Apparel stores versus $129k for stores selling beauty products or $131k for stores selling food & beverage products).
The margins tend to be similar though, with the median gross margin for apparel stores sitting at 62% (versus 63% for food & beverage stores and 69% for beauty stores).
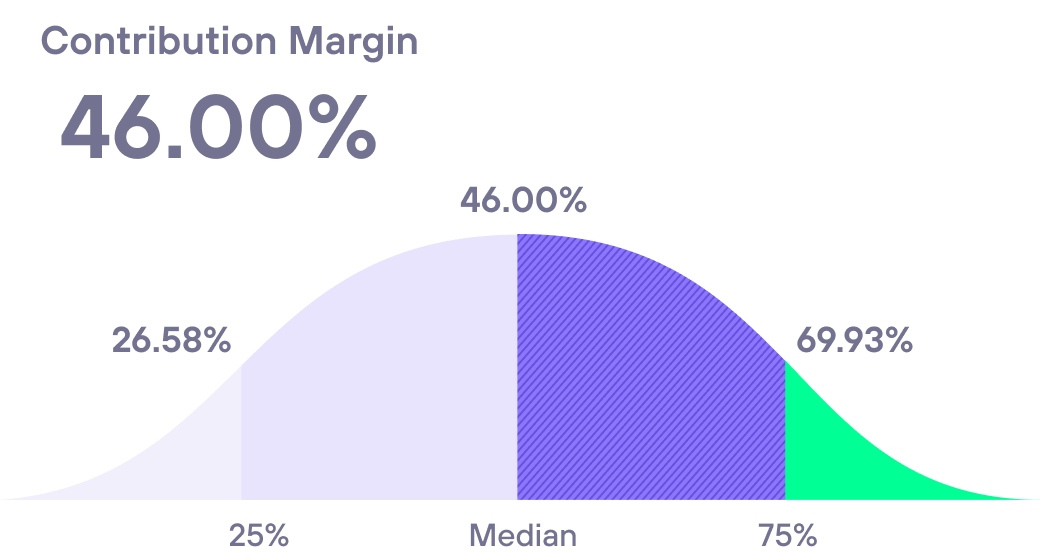
Contribution Margin
Contribution margin is calculated by taking the total sales minus discounts, refunds, taxes, COGS, and marketing spend and then divided by net sales.
Apparel and beauty brands who sell directly to consumers online generally see a contribution margin of around 40-46% How does your store's contribution margin compare against your competitors?
New Customer Acquisition Cost
Blended New Customer CAC refers to the total marketing spend divided by the number of new customers.
eCommerce Apparel stores have an average Blended New Customer CAC of $25-$30. What is your Blended New Customer CAC and how do you stack up against your competition?

Want to see benchmarks for your business?
Get a free report tailored to your industry, products, and business size.

Lifetimely is definitely one of the top few apps that you need in your store. The customer cohort analysis is essential to determine your most valuable customer types so that you can target more of them.
Wolven

Take a deep dive into eCommerce metrics
Profit and Loss
See how cashflow metrics compare to yours across a range of industries and business types.
Orders
See how order value metrics compare to yours across a range of industries and business types.
Retention
See how customer retention metrics compare to yours across a range of industries and business types.
Acquisition
See how customer acquisition metrics compare to yours across a range of industries and business types.
Industries
See how businesses in each industry compare to yours across our eleven key metrics.
Get your free Benchmarks report
Tailored to your business by industry, products sold, and more.
Every eCommerce metric you need
Run your Shopify store with unmatched analytics, at unmatched prices.
Ready to grow smarter?
See how Amp's suite of tools can help your Shopify store increase revenue and understand your customers.