Fashion Accessories eCommerce Benchmarks, compare data to stores like yours
Fashion Accessory stores experience a reasonable median total sales that is on par with the other categories in our data set ($187k vs $129.9k for beauty and $130.1k for food & beverage). They have quite a high average order value ($82 vs $63 in beauty and $56 in food & beverage) which would suggest the median total sales is driven more by a higher AOV than an increased order volume.
Fashion Accessory stores also experience favorable gross and contribution margins as well (median gross margin for fashion accessory stores is 72% versus 62.59% for apparel stores and 63.24% in the food & beverage category).
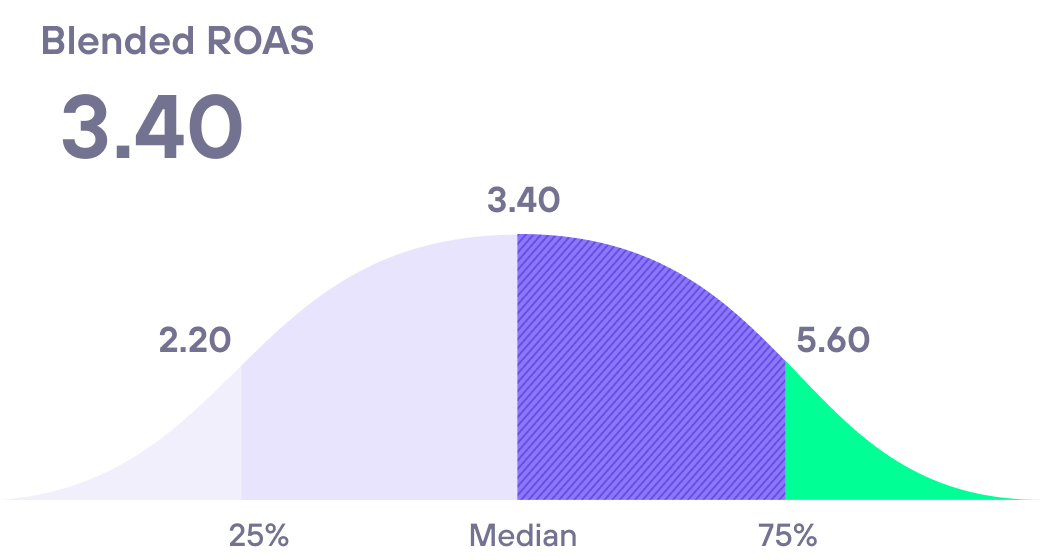
Return on Ad Spend
Blended ROAS refers to the total sales divided by total marketing spend.
Fashion Accessories businesses have a Blended ROAS of 3.20 on average. Do you know how your store's Blended ROAS stacks up against the competition?
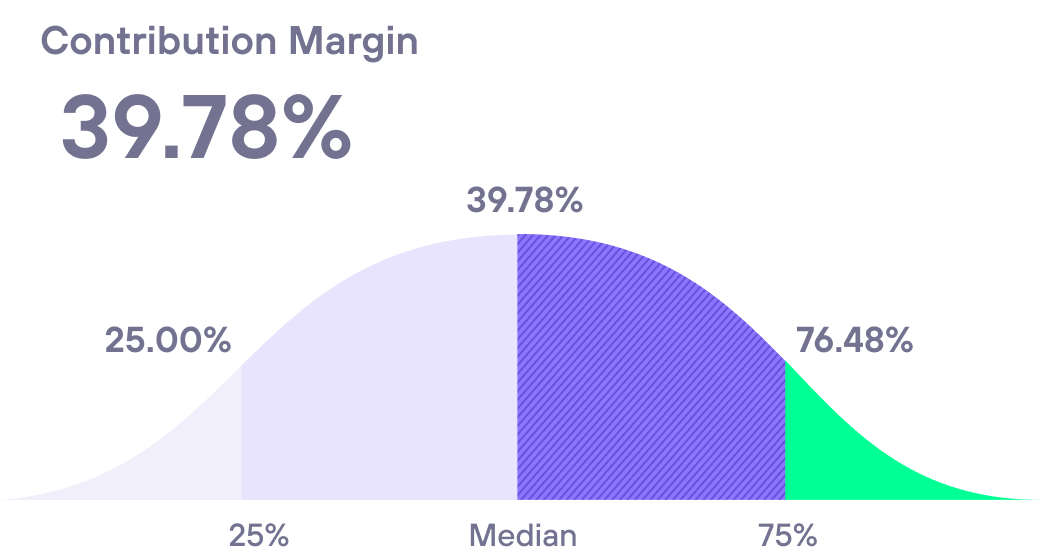
Contribution Margin
Contribution margin is calculated by taking the total sales minus discounts, refunds, taxes, COGS, and marketing spend and then divided by net sales.
Fashion Accessories stores selling online generally see a contribution margin of around 39.78%. How does your store's contribution margin compare against your competitors?
Want to see benchmarks for your business?
Get a free report tailored to your industry, products, and business size.

Lifetimely has greatly helped me and my brand REBEL8 gain important perspective of our customers. Highly recommend this app for all DTC brands looking to effectively scale and play the long game.
Rebel8

Take a deep dive into eCommerce metrics
Profit and Loss
See how cashflow metrics compare to yours across a range of industries and business types.
Orders
See how order value metrics compare to yours across a range of industries and business types.
Retention
See how customer retention metrics compare to yours across a range of industries and business types.
Acquisition
See how customer acquisition metrics compare to yours across a range of industries and business types.
Industries
See how businesses in each industry compare to yours across our eleven key metrics.
Get your free Benchmarks report
Tailored to your business by industry, products sold, and more.
Every eCommerce metric you need
Run your Shopify store with unmatched analytics, at unmatched prices.
Ready to grow smarter?
See how Amp's suite of tools can help your Shopify store increase revenue and understand your customers.