Food & Beverage eCommerce Benchmarks, compare data to stores like yours
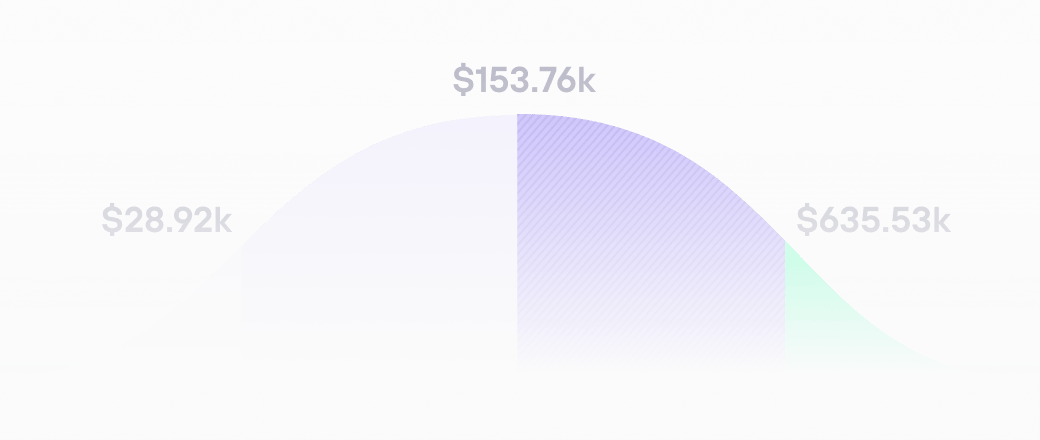
Food & Beverage stores tend to see lower median total sales numbers than other stores, with the median total sales for beauty stores being $131k versus $238k for health & fitness stores or $215k for stores selling homewares.
This is likely a reflection of customer average order value, with the median AOV for Food & Beverage stores sitting at $56 versus $111 for homewares stores and $96 for apparel stores
Blended ROAS
Blended ROAS refers to the total sales divided by total marketing spend.
50% of Food & Beverage brands have an average Blended ROAS of 5.80 but the top 25% of F&B brands have an average Blended ROAS of 13.35. Do you know what your Blended ROAS is and how you can improve your ROAS?

New Customer AOV
New Customer AOV refers to new customer sales (after discounts and before refunds) divided by the number of new customer orders in the time period.
Did you know that the average Food and Beverage brand’s New Customer AOV is $54.30. What is your AOV?


Want to see benchmarks for your business?
Get a free Benchmarks report tailored to your specific business (by industry, products sold, etc) using our FREE tool.

A powerhouse of an app at an amazing price! We've used it to help determine more accurate budget and sales forecasting. Setting up was a breeze and the support has been timely. Can't wait to see what more they add!
Harney & Sons Fine Teas

Take a deep dive into eCommerce metrics
-
Profit and Loss
See how cash flow metrics compare to yours across a range of industries and business types.
-
Orders
See how order value metrics compare to yours across a range of industries and business types.
-
Retention
See how customer retention metrics compare to yours across a range of industries and business types.
-
Acquisition
See how customer acquisition metrics compare to yours across a range of industries and business types.
-
Industries
See how businesses in each industry compare to yours across our eleven key metrics.

